

Nowadays the need for an easy way to add interactive charts becomes essential because we are shifting from pc applications to web application. jQuery and other libraries allows to make accessible data visualization in (x)HTML, giving us this needed functionality.
In this article we are going to present 5 chart libraries that suit different needs from simple charts to high complex charts. Most of them are free for personal and commercial use.
1. jQuery Visualize Plugin
jQuery Visualize Plugin is the perfect plugin if you have a table and want to generate a chart out of it. It offers different types of charts such as Bar, Area, Pie & Line charts.Examples
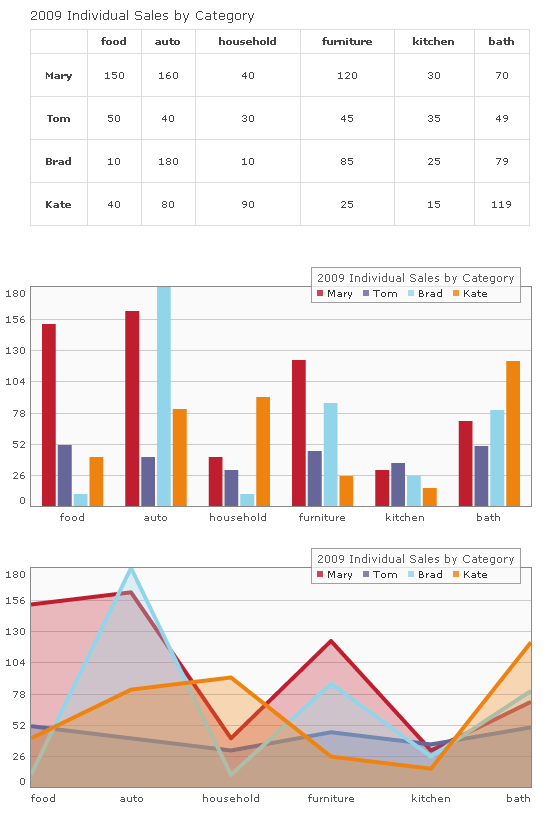
Type of Charts: Bar, Area, Pie & Line.
Requirements: jQuery, excanvas (included)
Browser Support: IE6*, IE7*, IE8*, Firefox 2, Firefox 3.5, Safari 3 and 4, Opera 9.
* HTML 5 canvas element is not supported by IE but Google maintains a library that translates canvas scripting into VML, allowing it to work in all versions of internet explorer.
Demo: http://www.filamentgroup.com/examples/charting_v2/index_2.php
License: MIT and GPL licenses
2. Highcharts
Highcharts is a really impressive jQuery Chart Library. In a few words Highcharts is compatible with most Browsers and even the iPhone; numerous chart types are supported; it is a dynamic plugin because you can add, remove and modify series, axes or points at any time after chart creation and you can load data from external files; tooltip labels are also supported which is great for detailed information in a point of a chart; zooming and last but not least all text labels can be rotated in any angle.Examples
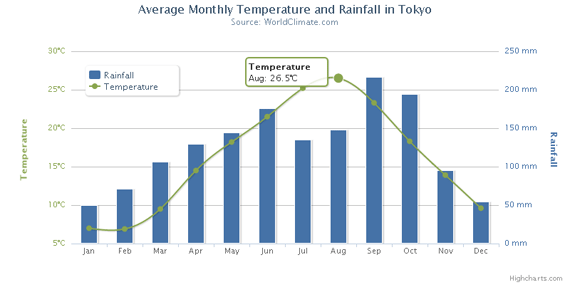
Line and column example
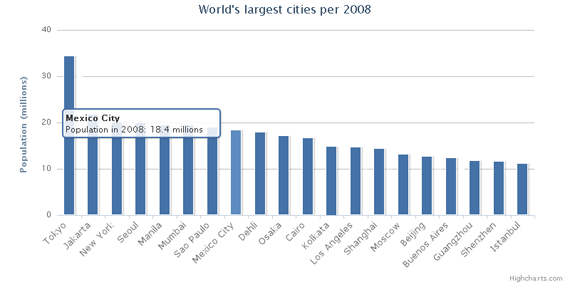
Columns with rotated labels
Requirements: jQuery or MooTools
Browser Support: IE6, IE7, IE8, Firefox 2, Firefox 3.5, Safari 3 and 4, Opera 9 and iPhone!
Demo: http://www.highcharts.com/demo/
License: Creative Commons Attribution Non-Commercial 3.0 License. Free for personal website, a school site or a non-profit organization. For a single commercial Website the license costs $80.
3. Flot
Flot is as the authors call it an “Attractive Javascript plotting for jQuery” which is true. The charts look simple and nice, it is easy to create charts and all settings are optional. Some key features of plot is turning series on/off, zooming, interacting with the data points and it integrates a simple tooltip feature.Examples
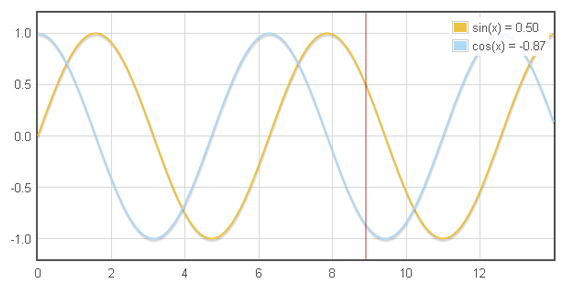
Tracking curves with crosshair plugin
Requirements: jQuery
Browser Support: IE6, IE7, IE8, Firefox 2, Firefox 3.5, Safari 3 and 4, Opera 9 and Konqueror 4+.
Demo: http://people.iola.dk/olau/flot/examples/
License: MIT License
4. jQuery Sparklines
Sparklines generates small inline charts either inline in the HTML or via JavaScript. It is really good for displaying mini graphs notably because most of them just take 1 line of HTML or JavaScript code. Another great feature is it self-refreshing capabilities. You can see it in their Mouse-Speed demo which shows you the power of live charting.Example
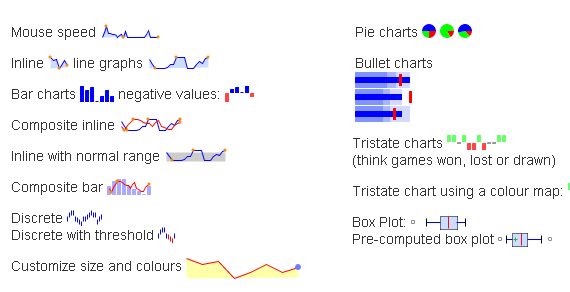
Type of Charts: Bar, Tristate, Bullet, Box Plot & Line.
Requirements: jQuery
Browser Support: IE6, IE7, IE8, Firefox 2, Firefox 3.5, Safari 3 and 4, Opera 9 and Google Chrome.
Demo: http://omnipotent.net/jquery.sparkline/
License: New BSD License
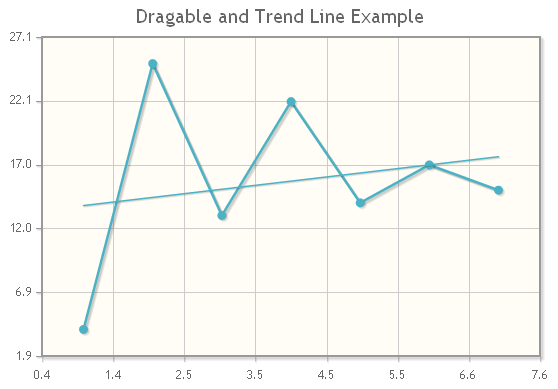
5. jqPlot
jqPlot did not catch my eye at first glance but after further research I found it to be one of the best and free jQuery chart library. Numerous graphical options are available you can even add shadows and interact per drag&drop in the charts! It even automatically computes trend lines. We could compare it to highcharts in terms of features and functionality.Examples
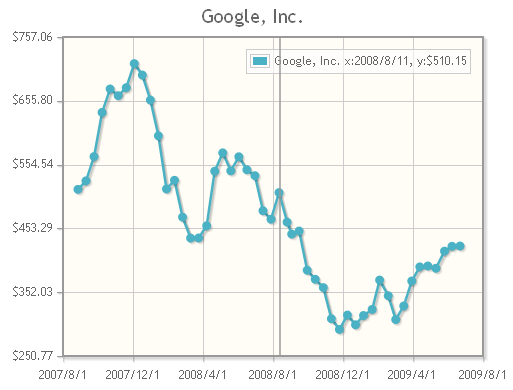
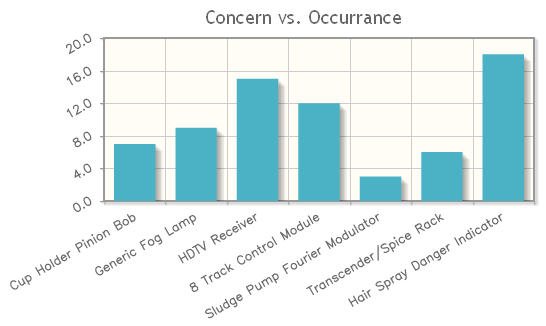
Type of Charts: Bar, Pie & Line.
Requirements: jQuery
Browser Support: IE6, IE7, IE8, Firefox 2, Firefox 3.5, Safari 3 and 4, Opera 9 and Google Chrome.
Demo: http://www.jqplot.com/tests/
License: MIT and GPL version 2 licenses
Conclusion
As you may have seen from this 5 jQuery chart libraries they suit different needs. First Sparklines generates a small inline chart which is perfect for charts where the precision is not important. You look at the small chart and you should directly know what happened.Highcharts, Flot and jqPlot are very powerful jQuery chart libraries. My personal favourites is Highcharts and jqPlot. The visual quality of Highcharts charts are better than jqPlot but the last one is free. I recommend you to test at least one of them and you will see that they are really powerful.
Finally jQuery Visualize is really easy to use and specially adapted if you want to create a chart out of a table, just like you would do it in excel. This can be convenient when you need a table and a chart to visualize your thoughts. Feel free to give your feedback via comments section.:)
I have also featured those together with hundreds of others. You might want to check out my Visualisation References resource list, aspiring to be the most comprehensive on the net. If you miss anything that I might be able to find for you or if you yourself want to share a resource, please leave a comment.
BalasHapus